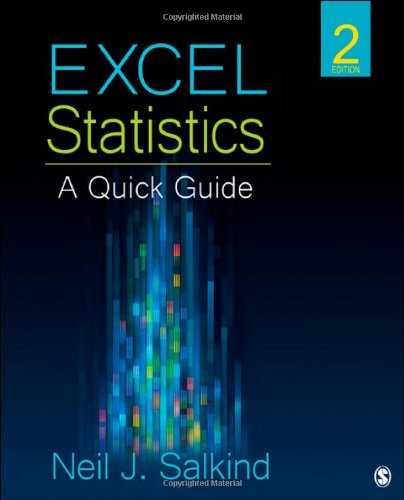

Excel statistics a quick guide Neil J. Salkind.
Detalles de publicación: Thousand Oaks SAGE c2013.Edición: 2nd edDescripción: xv, 139 pages illustrations 24 centimetersISBN:- 9781452257921 (pbk.)
- 005.54 23
- HF5548.4.M523 S263 2013
| Imagen de cubierta | Tipo de ítem | Biblioteca actual | Biblioteca de origen | Colección | Ubicación en estantería | Signatura topográfica | Materiales especificados | Info Vol | URL | Copia número | Estado | Notas | Fecha de vencimiento | Código de barras | Reserva de ítems | Prioridad de la cola de reserva de ejemplar | Reservas para cursos | |
|---|---|---|---|---|---|---|---|---|---|---|---|---|---|---|---|---|---|---|
| Libro | Biblioteca de Mayagüez Colección General mb | HF5548.4 .M523 S263 2013 (Navegar estantería(Abre debajo)) | Disponible | 50000003241287 |
Descripciones mejoradas de Syndetics:
Use real data, and become a pro at using Excel for statistical analysis!
Designed for users already familiar with Excel and basic computer operations, this Second Edition of Neil J. Salkind's Excel Statistics: A Quick Guide shows readers how to utilize the features of Microsoft Excel to answer both simple and complex questions about data analysis. Part I explores thirty-five Excel functions while Part II of the text contains fifteen Analysis Toolpak tools. The description and use of each function and tool appear on one page with corresponding screen shots of the element in action on the facing page, allowing the user to see what each function or tool looks like as it is being applied. The actual data files used in the examples are also available to readers. Excel novices and experts alike will find this text not only practical but also easy to use and engaging.
Includes bibliographical references and index.
Tabla de contenidos provista por Syndetics
- How to Use This Book(p. ix)
- Acknowledgments(p. xiii)
- About the Author(p. xv)
- Part I Using Excel Functions(p. 1)
- 1 Computing Averages(p. 8)
- Excel QuickGuide 1 The Average Function(p. 8)
- Excel QuickGuide 2 The Median Function(p. 10)
- Excel QuickGuide 3 The Mode.sngl Function(p. 12)
- Excel QuickGuide 4 The Geomean Function(p. 14)
- 2 Looking at Variability(p. 16)
- Excel QuickGuide 5 The Stdev.S Function(p. 16)
- Excel QuickGuide 6 The Stdev.P Function(p. 18)
- Excel QuickGuide 7 The Var.S Function(p. 20)
- Excel QuickGuide 8 The Var.P Function(p. 22)
- 3 Describing Data(p. 24)
- Excel QuickGuide 9 The Frequency Function(p. 24)
- Excel QuickGuide 10 The Norm.dist Function(p. 26)
- Excel QuickGuide 11 The Percentile.inc Function(p. 28)
- Excel QuickGuide 12 The Percentrank.inc Function(p. 30)
- Excel QuickGuide 13 The Quartile.inc Function(p. 32)
- Excel QuickGuide 14 The Rank.avg Function(p. 34)
- Excel QuickGuide 15 The Standardize Function(p. 36)
- 4 Looking at Relationships(p. 38)
- Excel QuickGuide 16 The Covariance.S Function(p. 38)
- Excel QuickGuide 17 The Correl Function(p. 40)
- Excel QuickGuide 18 The Pearson Function(p. 42)
- Excel QuickGuide 19 The Intercept Function(p. 44)
- Excel QuickGuide 20 The Slope Function(p. 46)
- Excel QuickGuide 21 The Trend Function(p. 48)
- Excel QuickGuide 22 The Forecast Function(p. 50)
- Excel QuickGuide 23 The RSQ Function(p. 52)
- 5 Testing Independence(p. 54)
- Excel QuickGuide 24 The Chisq.Dist Function(p. 54)
- Excel QuickGuide 25 The Chisq.Test Function(p. 56)
- 6 Testing Significance(p. 58)
- Excel QuickGuide 26 The F.Dist Function(p. 58)
- Excel QuickGuide 27 The F.Test Function(p. 60)
- Excel QuickGuide 28 The T.Dist Function(p. 62)
- Excel QuickGuide 29 The T.Test Function(p. 64)
- Excel QuickGuide 30 The Z.Test Function(p. 66)
- 7 Looking at Data(p. 68)
- Excel QuickGuide 31 The Averageif Function(p. 68)
- Excel QuickGuide 32 The Count Function(p. 70)
- Excel QuickGuide 33 The Counta Function(p. 72)
- Excel QuickGuide 34 The Countblank Function(p. 74)
- Excel QuickGuide 35 The Countif Function(p. 76)
- Part II Using the Analysis Toolpak(p. 79)
- 8 Describing Data(p. 79)
- Excel QuickGuide 36. Descriptive Statistics(p. 82)
- Excel QuickGuide 37. Moving Average(p. 84)
- Excel QuickGuide 38. Random Number Generation(p. 86)
- Excel QuickGuide 39. Rank and Percentile(p. 88)
- Excel QuickGuide 40. Sampling(p. 90)
- 9 Comparing Means(p. 92)
- Excel QuickGuide 41. z-Test: Two-Sample for Means(p. 92)
- Excel QuickGuide 42. t-Test: Paired Two-Sample for Means(p. 94)
- Excel QuickGuide 43. t-Test: Two-Sample Assuming Unequal Variances(p. 96)
- Excel QuickGuide 44. t-Test: Two-Sample Assuming Equal Variances(p. 98)
- Excel QuickGuide 45. Anova: Single Factor(p. 100)
- Excel QuickGuide 46. Anova: Two-Factor With Replication(p. 102)
- Excel QuickGuide 47. Anova: Two-Factor Without Replication(p. 104)
- 10 Looking at Relationships(p. 106)
- Excel QuickGuide 48. The Correlation Tool(p. 106)
- Excel QuickGuide 49. The Regression Tool(p. 108)
- 11 Illustrating Data(p. 110)
- Excel QuickGuide 50. The Histogram Tool(p. 110)
- Appendix A Answers to QuickGuide Questions(p. 113)
- Appendix B Using the Macintosh Excel Formula Builder(p. 133)
- Index(p. 137)