
| Imagen de cubierta | Tipo de ítem | Biblioteca actual | Biblioteca de origen | Colección | Ubicación en estantería | Signatura topográfica | Materiales especificados | Info Vol | URL | Copia número | Estado | Notas | Fecha de vencimiento | Código de barras | Reserva de ítems | Prioridad de la cola de reserva de ejemplar | Reservas para cursos | |
|---|---|---|---|---|---|---|---|---|---|---|---|---|---|---|---|---|---|---|
| Libro | CARIBET Biblioteca Arquitectura Colección General CARIBET | NC998.4.D38 2010 (Navegar estantería(Abre debajo)) | Disponible | 91000000023697 |
Descripciones mejoradas de Syndetics:
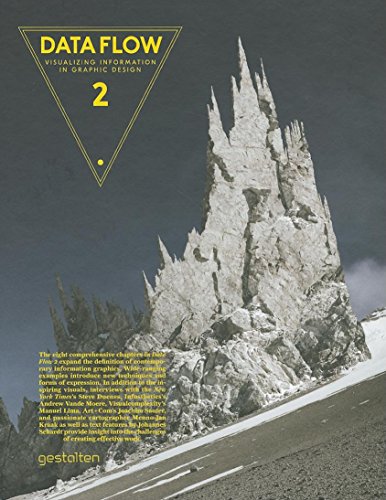
International interest in the sophisticated and aesthetic visualization of complex information made Data Flow a bestseller. Today, more and more graphic designers, advertising agencies, motion designers, and artists work in this area. New techniques and forms of expression are being developed. Consequently, the demand for information on this topic has grown enormously. Data Flow 2 expands the definition of contemporary information graphics. The book features new possibilities for diagrams, maps, and charts. It investigates the visual and intuitive presentation of processes, data, and information. Concrete examples of research and art projects as well as commercial work illuminate how techniques such as simplification, abstraction, metaphor, and dramatization function. The book also includes interviews with experts such as The New York Times s Steve Duenes, Infosthetics's Andrew Vande Moere, Visualcomplexity's Manuel Lima, ART+COM's Joachim Sauter, and passionate cartographer Menno-Jan Kraak as well as text features by Johannes Schardt about the challenges in creating effective information graphics and about the relationship between complexity, clarity, content, and innovation. Offering practical advice, background information, case studies, and inspiration, Data Flow 2 is a valuable reference for anyone working with or interested in information graphics.