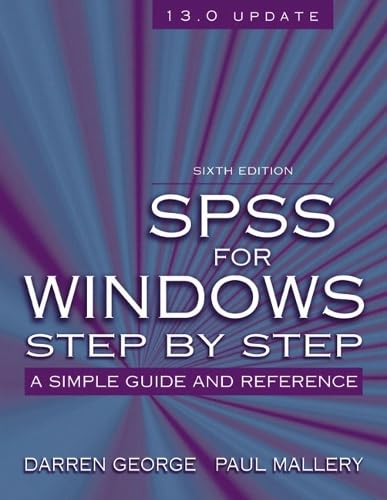
Imagen de Amazon.com

Portada de Syndetics
Imagen de OpenLibrary
SPSS for Windows step by step a simple guide and reference, 13.0 update Darren George, Paul Mallery.
Detalles de publicación: Boston Pearson A and B c2006.Edición: 6th edDescripción: 386 p. ill. 28 cmISBN:- 0205480713
- 519.50285536 G3476s6 22
- HA32 .G458 2006
| Imagen de cubierta | Tipo de ítem | Biblioteca actual | Biblioteca de origen | Colección | Ubicación en estantería | Signatura topográfica | Materiales especificados | Info Vol | URL | Copia número | Estado | Notas | Fecha de vencimiento | Código de barras | Reserva de ítems | Prioridad de la cola de reserva de ejemplar | Reservas para cursos | |
|---|---|---|---|---|---|---|---|---|---|---|---|---|---|---|---|---|---|---|
| Libro | Biblioteca de Mayagüez Colección General mb | HA32 .G458 2006 (Navegar estantería(Abre debajo)) | Disponible | 50000003170650 | ||||||||||||||
| Libro | Biblioteca Encarnación Valdés Colección General bev | 519.50285536 G3476s6 (Navegar estantería(Abre debajo)) | Overdue(pending) | 80000002275330 |
Total de reservas: 0
Descripciones mejoradas de Syndetics:
This text covers all major SPSS procedures for version 11.0 and earlier versions. Each analysis chapter is organized according to a structured, identical format, with step-by-step instructions.
gccdic2006
Includes bibliographical references (p. [379]-380) and index.
Tabla de contenidos provista por Syndetics
- 1 An Overview of SPSS for Windows Step by Step(p. 1)
- 2 SPSS Windows Processes: Mouse and keyboard processing, frequently-used dialog boxes, editing output, printing results, the Options Option(p. 9)
- 3 Creating and Editing a Data File(p. 27)
- 4 Managing Data: Listing cases, replacing missing values, computing new variables, recoding variables, exploring data, selecting cases, sorting cases, merging files(p. 43)
- 5 Graphs: Creating and editing graphs and charts(p. 67)
- Base System Module
- 6 Frequencies: Frequencies, bar charts, histograms, percentiles(p. 83)
- 7 Descriptive Statistics: Measures of central tendency, variability, deviation from normality, size, and stability(p. 95)
- 8 Crosstabulation and Chi-Square (X[superscript 2]) Analyses(p. 105)
- 9 The Means Procedure(p. 115)
- 10 Bivariate Correlation: Bivariate correlations, partial correlations, and the correlation matrix(p. 123)
- 11 The T Test Procedure: Independent-samples, paired-samples, and one-sample tests(p. 133)
- 12 The One-Way Anova Procedure: One-way Analysis of Variance(p. 143)
- 13 General Linear Models: Two-Way Analysis of Variance(p. 153)
- 14 General Linear Models: Three-Way Analysis of Variance and the influence of covariates(p. 161)
- 15 Simple Linear Regression(p. 177)
- 16 Multiple Regression Analysis(p. 191)
- 17 Nonparametric Procedures(p. 207)
- 18 Reliability Analysis: Coefficient alpha ([alpha]) and split-half reliability(p. 221)
- 19 Multidimensional Scaling(p. 233)
- 20 Factor Analysis(p. 245)
- 21 Cluster Analysis(p. 261)
- 22 Discriminant Analysis(p. 277)
- Advanced and Regression Modules
- 23 General Linear Models: Manova and Mancova Multivariate Analysis of Variance and Covariance(p. 293)
- 24 General Linear Models: Repeated-Measures Manova: Multivariate Analysis of Variance with repeated measures and within-subjects factors(p. 309)
- 25 Logistic Regression(p. 321)
- 26 Hierarchical Loglinear Models(p. 333)
- 27 General Loglinear Models(p. 347)
- 28 Residuals: Analyzing left-over variance(p. 357)
- Data Files(p. 365)
- Glossary(p. 369)
- References(p. 379)
- Index(p. 381)